D3 JSON Data
In this section, you will understand how using JSON can simplify your D3.js code as well as your JavaScript code.
We will cover previous examples, how to bind JSON objects to the __data__ attribute and how we can use JSON to clean up the code for easier comprehension.
JSON
JSON stands for JavaScript Object Notion.
This is a JavaScript data structure where the indices are named.
The JSON is a collection of name/value pairs.
In JSON, the name must always be in double quotes. As an example:
This allows us to get specific information from our variable using a "dot" by writing secretAgent.number
This gives us the following in the Chrome JavaScript Console
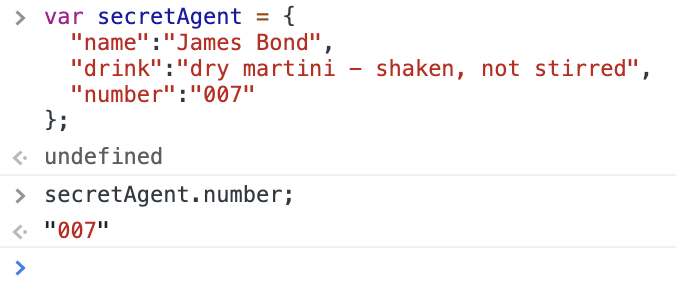
This makes referencing code and data much easier.
Array of JSON Objects
As we discussed at the top of this section - Arrays can hold any type of information, even JSON.
Going back to our circle examples in a previous section (Using the SVG Coordinate Space With D3.js), we could write all the necessary data to visualize our circles are an array of circle objects:
Let's look at the jsonCircles variable in the Chrome JavaScript Console:
We can see that jsonCircles is an array of three objects:
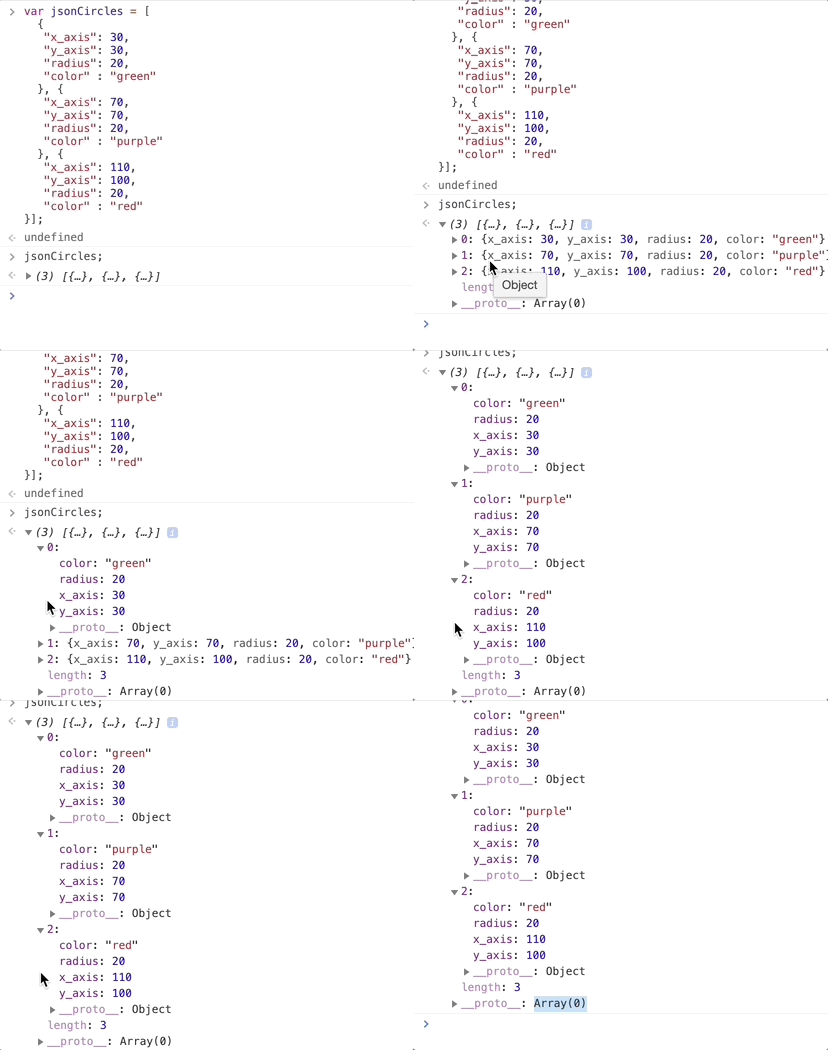
Let's rewrite our jsonCircles variable with lots of blank spaces and make the definitions more compact so that we can compare across lines:
Now we can get data from any JSON object in the array of JSON objects.
We can also get data from a key value pair out of a specific JSON object.
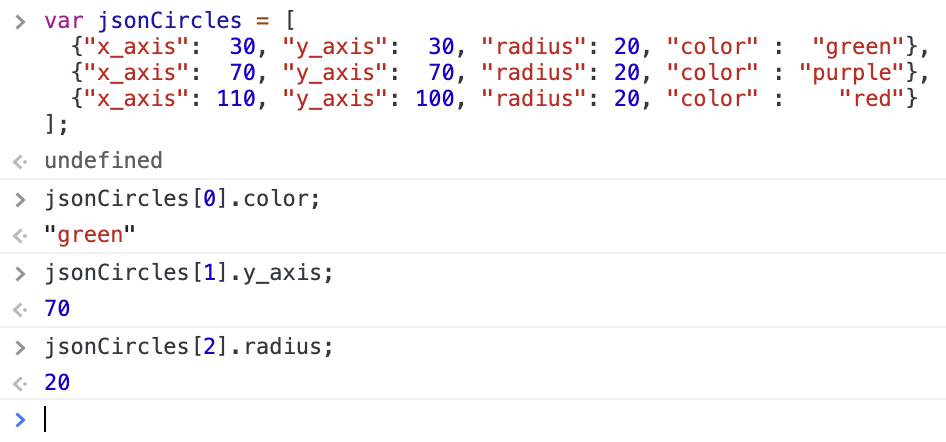
For example, let's get the "color" of the first circle by typing jsonCircles[0].color into the JavaScript Console (remember JavaScript are 0-based indexed):
The result is:
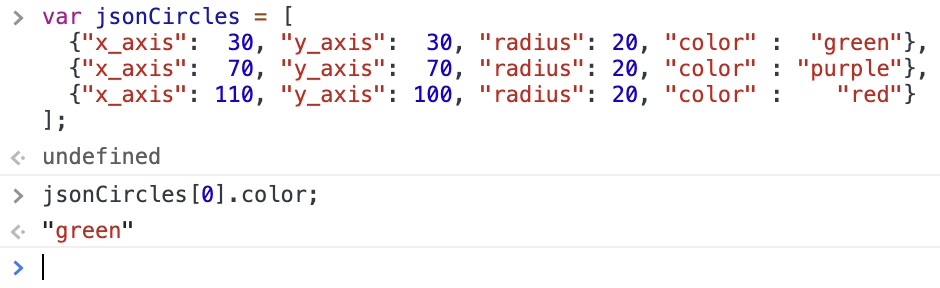
We can the "y_axis" value for the second circle by typing jsonCircles[1].y_axis into the JavaScript Console:
The result is:
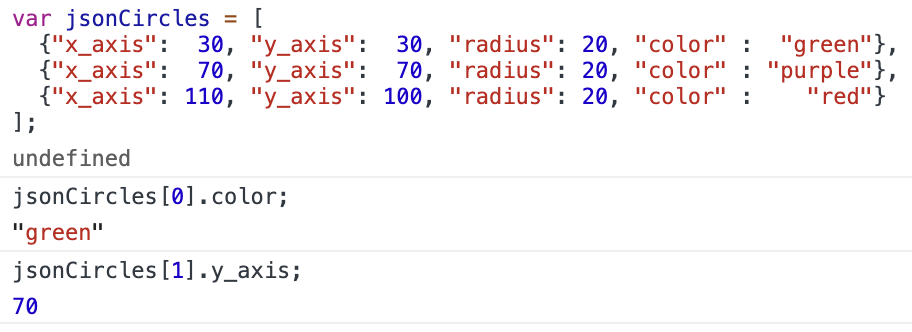
We can the "radius" value for the second circle by typing jsonCircles[2].radius into the JavaScript Console:
The result is:
This will be extremely useful in the next and subsequent sections for use inside of functions when using D3.js operators and methods.
Previous Example of Three Circles
In the Using the SVG Coordinate Space With D3.js section, we created and styled three circles using D3.js using the following D3 code:
Running that code in the Chrome JavaScript Console, gave us the following on the webpage:
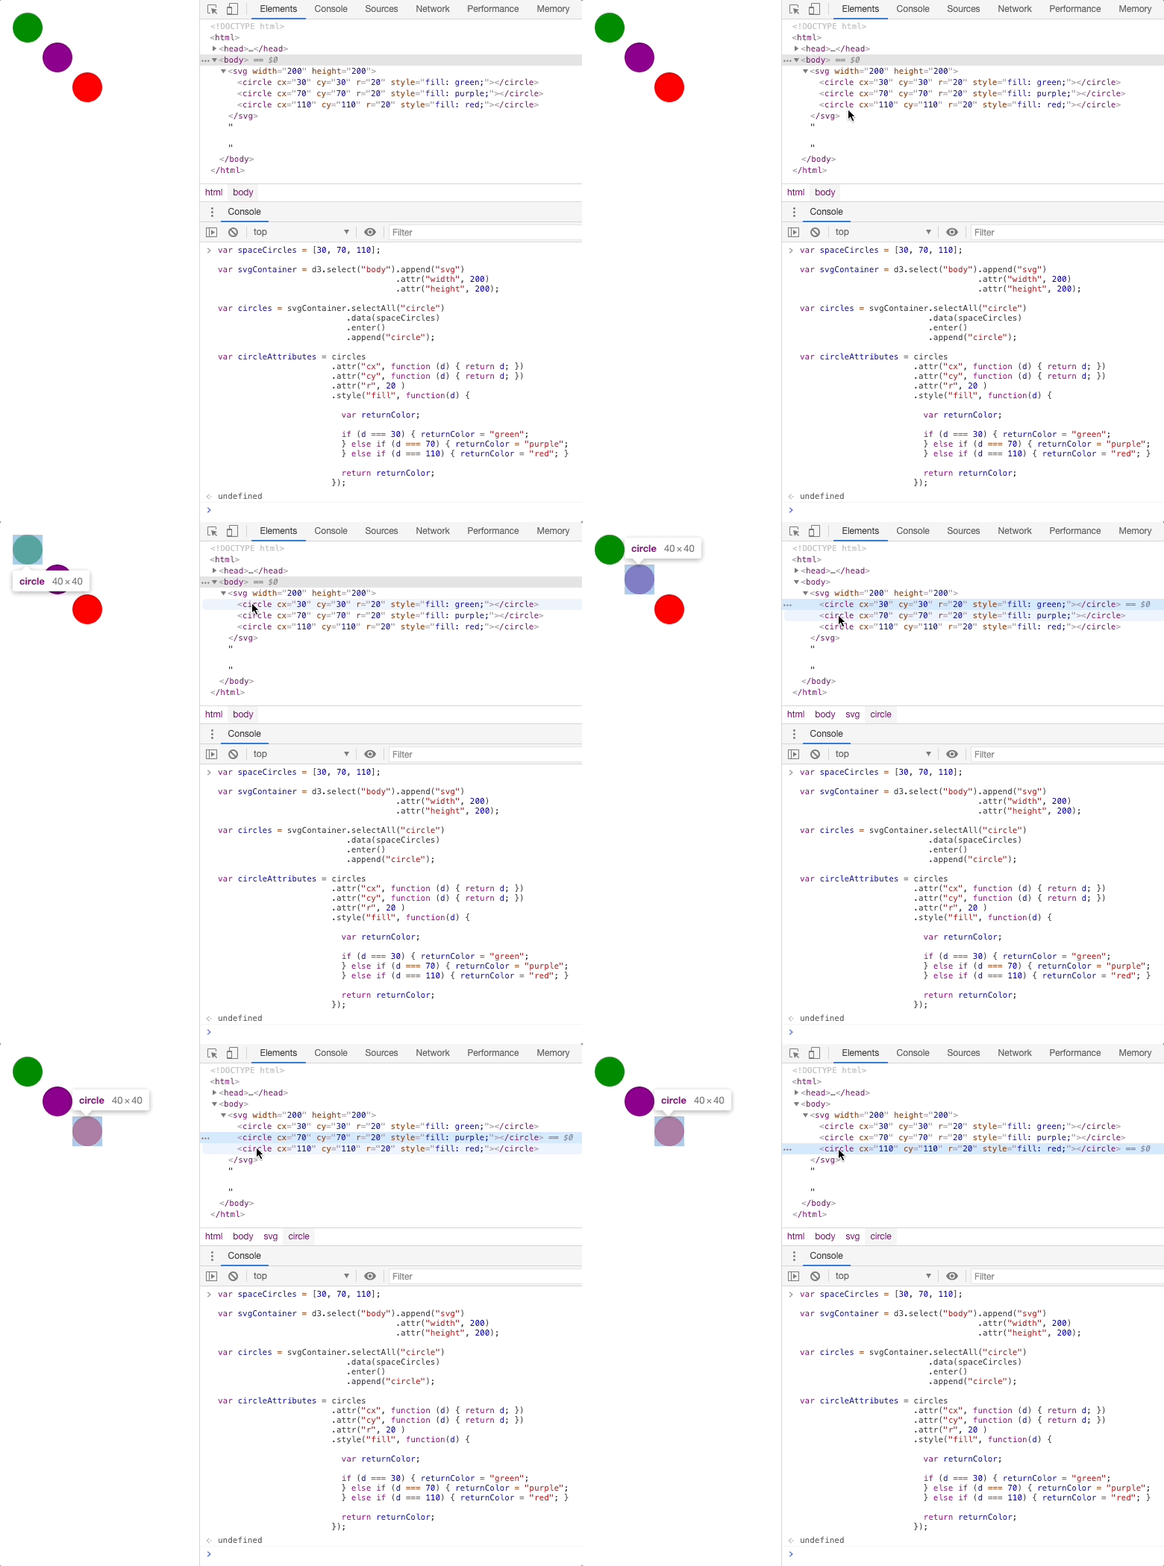
This example used the data to set the cx, cy and style fill for each circle.
However, as you probably noticed, the cx and cy units were the same.
Also - perhaps more dangerous, was that the if statements had hard coded values ("green", "purple", "red").
Hard coded values are never a good idea, because if our data changes, then we would have to change our code in several places.
Binding JSON Objects to the __data__ Attribute
In the Data Structures D3.js Accepts section, we covered how we could use JavaScript JSON Objects in the Data Array we pass to D3.js.
Using our example above (the three circles) and the JSON notation, we could write our data structure as JSON :
Note that we have moved our color from the if ... then functions in the D3.js code to our data.
This will not always be possible. For now, we will assume it is possible and deal with other cases later.
In doing this, we can now type the following into our JavaScript Console:
Which gives us this in the webpage:

To check to make sure the right D3 JSON data was bound to the right SVG Circle DOM element, let's look at the JavaScript circles variable we created.
This circles variable will contain the D3 selection containing the SVG Circle elements.
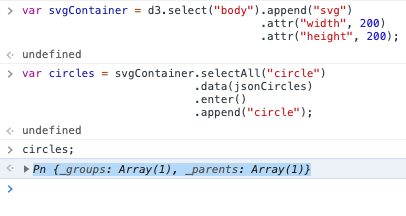
To access it, we type the following into the JavaScript console:
This gives us:
We then click into it and scroll down to look for the __data__ property:
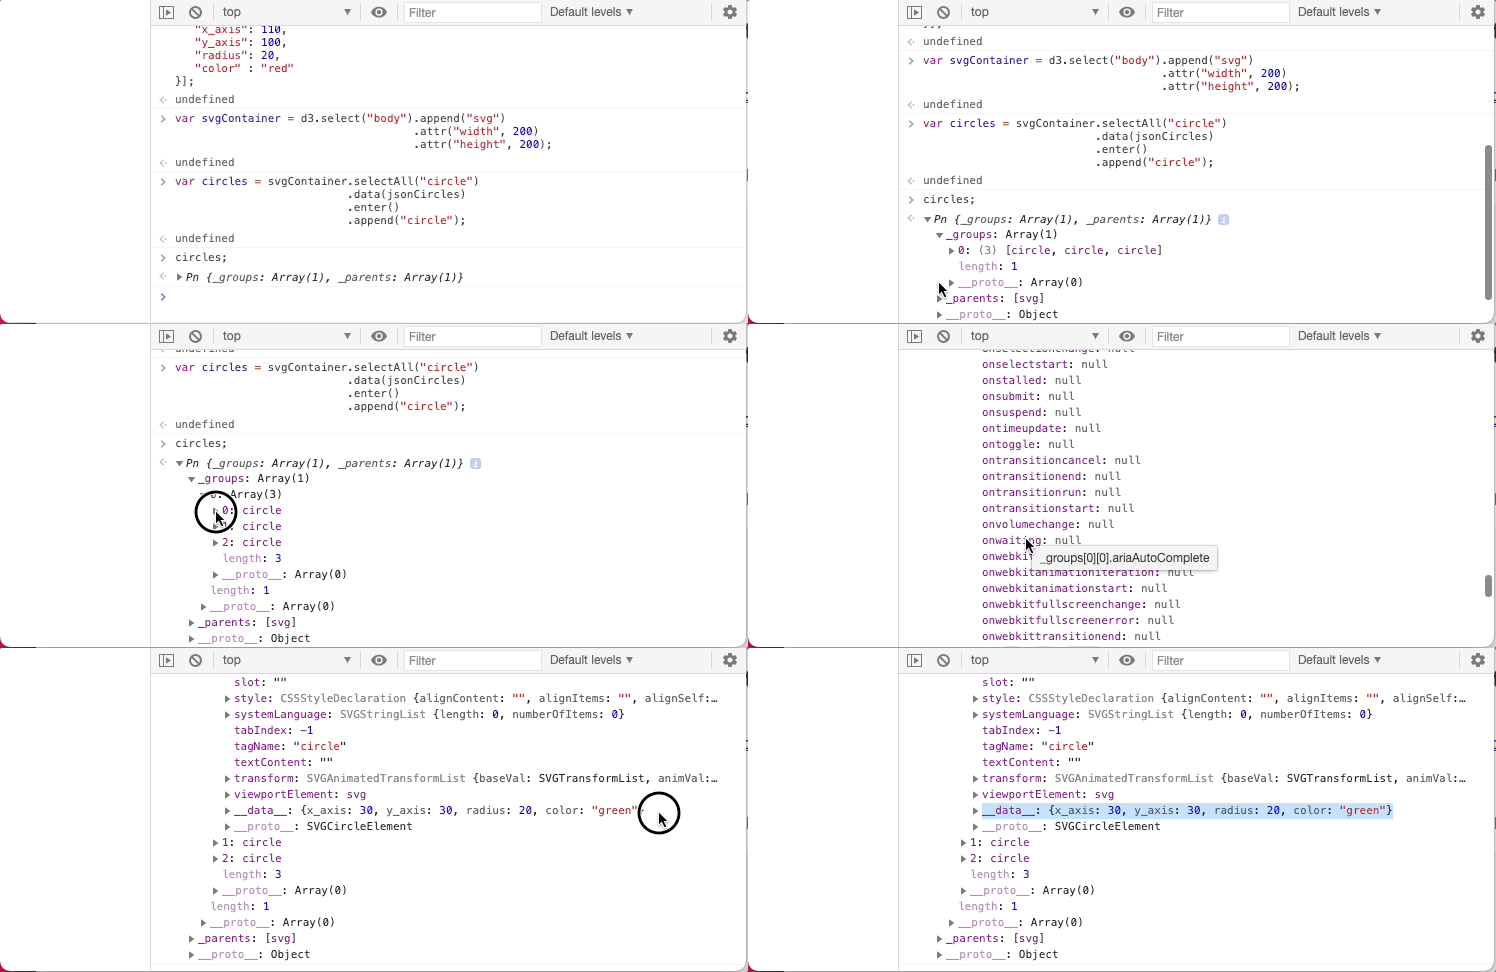
As you can see the first JSON data element from the jsonCircles data structure was bound to the first SVG Circle element.
Which is fantastic!
Before we had been able to bind a single number to the __data__ attribute.
Now we have bound a JSON object to the __data__ attribute.
And because the object is bound to the __data__ attribute, it means that D3.js can use it within its operator and methods!
Use Bound JSON Objects to Alter SVG Elements
We will now use the bound JSON Objects in the __data__ attribute to alter the SVG Circles.
If you recall the Use D3.js To Create SVG Elements Based on Data section, we discussed the key to using the bound data, being the JavaScript function:
Above, we covered how JSON objects allow us to use their name/value pair to call specific data from them:
Combining these two pieces of knowledge, allows us to write the following anonymous functions that use JSON Object key value pairs to get data in D3.js:
Where name is the name associated with the specific name/value pair in the JSON Object.
In our case, using our jsonCircles JSON data array that we re-wrote above to make it easier to compare across lines, we have:
Remember that the extra spaces in the JSON definition don't matter as long as they are outside of the double quotes.
With that JSON data structure we can use D3 to access the JSON key value pairs using JavaScript Anonymous Functions