Use D3 v6 to add SVG elements to a Data Visualization
In this section, you will use D3.js to add SVG elements to specific coordinates in a graph based on data.
Our Goal is to take the following data set:
and transform it to this data visualization using D3.js v6:
Notice how each SVG circle is placed at a different place on the data visualization.
Notice how each SVG circle has a different color in the data visualization.
The creation, placement, and styling of the SVG circle will all be done with D3.
Mathematical / Graph Coordinate Space
Before we get into using D3.js to add SVG elements to specific coordinates in a graph based on data, let us talk about the coordinate space.
We learned about basic mathematical graphs in basic mathematics.
These graphs are a 2-dimensional flat space represented as a rectangle.
These graphs have a coordinate space where x=0 and y=0 coordinates fall on the bottom left.
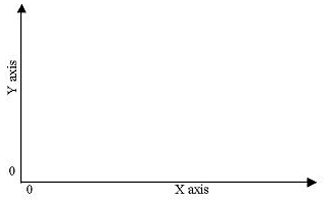
These graphs have the X coordinate growing from left to right.
These graphs also have the Y coordinate growing from bottom to top.
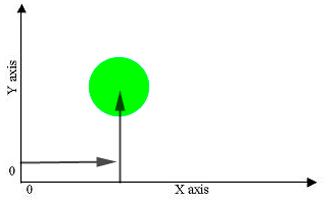
Which means, when we talk about drawing a circle with x=30 and y=30 coordinates, we go 30 units from the bottom left to the right and then we go 30 units up.
SVG Coordinate Space
SVG Coordinate Space works in the same way that mathematical graph coordinate space works except for two important features:
1 - SVG Coordinate space has x=0 and y=0 coordinates fall on the top left.
2 - SVG Coordinate space has the Y coordinate growing from top to bottom.
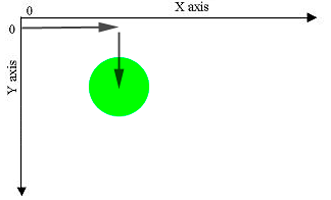
SVG coordinate space x and y axis:
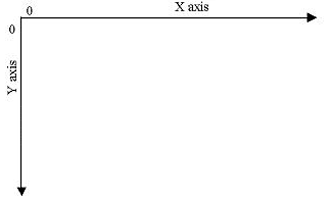
Which means as Y increases, the coordinates move down, not up.
So when we talk about drawing a circle with x=30 and y=30 coordinates in SVG Coordinate Space, we go 30 units from the top left to the right and then we go down 30 units up.
.append('svg') as a Coordinate Space
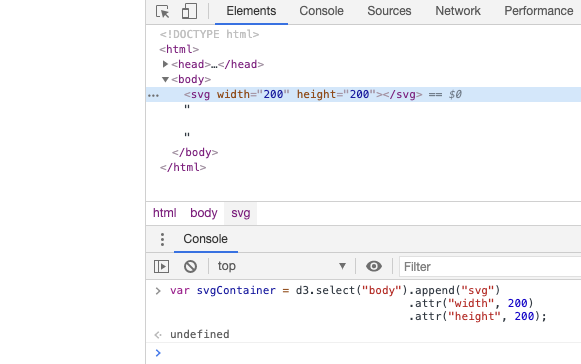
When we have created a D3.js visualization so far, we have started with the following JavaScript and D3 v6 code:
Which gives us this the following HTML SVG DOM element:
Once we have created the SVG Container with D3.js v6, we will visualize our data within this container.
Until now, we had glossed over how to think about this SVG element. No longer!
We can think of this SVG element as a graph 200 units wide and 200 units tall.
And with what we learned from the above section ( SVG Coordinate Space ), we now know that the X and Y zero coordinates are at the top left.
We also now know that as the Y coordinate grows, it will move from the top to the bottom of our graph.
To clarify what this looks like, here's a GIF video showing where our 200 x 200 SVG container is on this webpage:
So you can see that the HTML DOM element with the tag of "SVG" has a width of 200 and a height of 200.
This is useful for thinking about how the data visualization takes shape given the inverted Y coordinate system.
Position SVG Elements in the SVG Coordinate Space
When we create an SVG Circle element in the following fashion:
The cx tells us to move 25 units from the left to the right of the SVG element.
The cy tells us to move 25 units from the top to the bottom of the SVG element.
Recall how we created an SVG circle with D3.js before:
The .attr("cx", 25) and .attr("cy", 25) allow us to set the attributes of the SVG circle.
And as we saw later in the Use D3.js To Create SVG Elements Based on Data section, we can programmatically set these attributes:
Except, this time, instead of using a function in the "radius" r attribute, we will use a function in the cx and cy attributes.
Create an SVG Element to Hold SVG Elements
Start with a basic webpage
Open the JavaScript Console with the HTML elements visible.
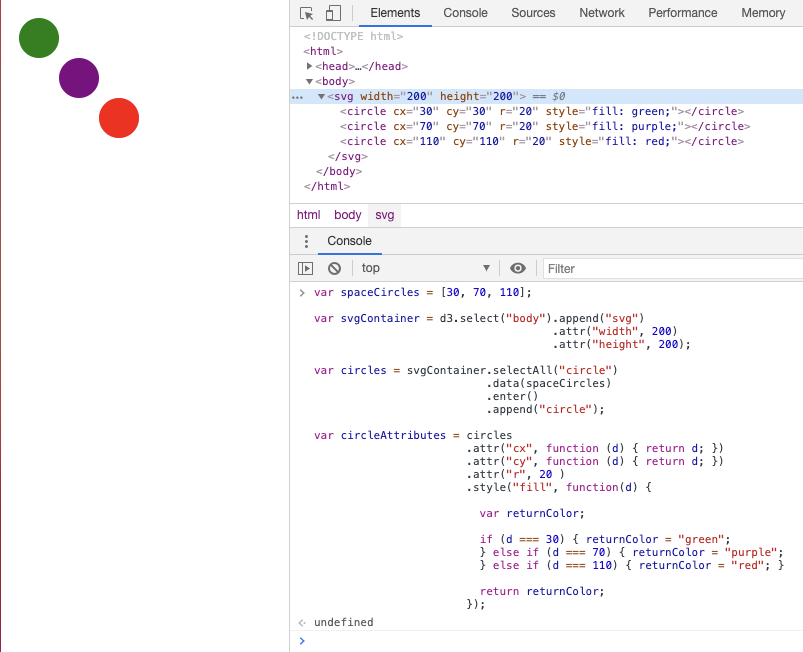
Then type the following into the JavaScript Console:
This gives us the data set and an SVG element to hold the SVG Circles we will add shortly:
Bind Data to SVG Circles
The next step will be to take the data and bind it to our SVG Circle elements using D3 v6:
This gives us the three SVG circle elements in our webpage:
Which is great - though the circles don't appear.
This is because have not specified the attributes for each circle.
Use Bound Data to Alter SVG Circle Coordinates
Now that the data is bound to the SVG Circle Elements, we can use it to specify the attributes for the x-coordinate and y-coordinate.
D3.js allows us to use a function in the "cx" and "cy" attributes:
As you can see from the above code, we added the attributes to our circle selection.
The data set specifies the circle center's x-coordinate and y-coordinate, so we use D3.js to update the "cx" and "cy" SVG Circle Element attribute for each SVG Circle.
If we run this in the JavaScript Console we get:
We are getting close.
We now have three SVG Circle Elements and their coordinates correspond to the coordinates given in the the data set.
The last thing we have to do is to color the SVG Circle based on the data.
Styling SVG Elements Based on Data Revisited
If you recall the Use D3.js To Create SVG Elements Based on Data section, we used the bound data to alter the SVG element's style.
Let's reset the browser and type in (or copy/paste) new JavaScript and D3 v6 code in as we want the circles to be styled.
* Reset Browser *
As we saw before, D3.js lets us use a function inside of the .style() operator - which means we can write the following:
Running the above JavaScript code in the JavaScript Console gives us this:
Congratulations - You created, styled, and placed SVG elements in the SVG Coordinate Space based on data from a data set!